Software and RNA-seq analysis
Sonar: A Visual Analytics Framework for Analysing Private and Public RNA seq data:

Next-Generation Sequencing (NGS) has been widely accepted as an essential tool in molecular biology. Reduced costs and automated analysis pipelines make the use of NGS data feasible even for small labs, yet the methods for interpreting the data are not sophisticated enough to account for the amount of information.

Often, the learning lies not in analysing isolated datasets, but knowledge can rather be gained by context information, i.e. visually comparing datasets side-by-side. This approach to data exploration is termed Visual Analytics.

We have developed s·nr (pronounced sonar), a Visual Analytics pipeline that provides simple yet powerful visual interfaces for displaying and querying NGS data. It allows researchers to explore their own data in the context of experimental data deposited in public repositories, as well as to extract specific data sets with similar gene expression signatures. We tested s·nr on 1,543 RNA-Seq based mouse differential expression profiles derived from the public ArrayExpress platform. The repository of processed data is available with out paper (Klemm et al 2019 BMC Bioinformatics).
s·nr is easily deployable utilizing its containerized implementation, empowers researchers to analyze and relate their own RNA-Seq as well as to provide interactive and contextual crosstalk with data from public repositories. This allows users to deduce novel and unbiased hypotheses about the underlying molecular processes.
The analysis focus is typically on one experiment. To put it into context of other data and observe pat- terns over multiple experiments, we include additional data. The user interface is divided into two major components. The overview visualization shows which experiments express similar expression profiles and allows users to select experiments for further investigation (left).
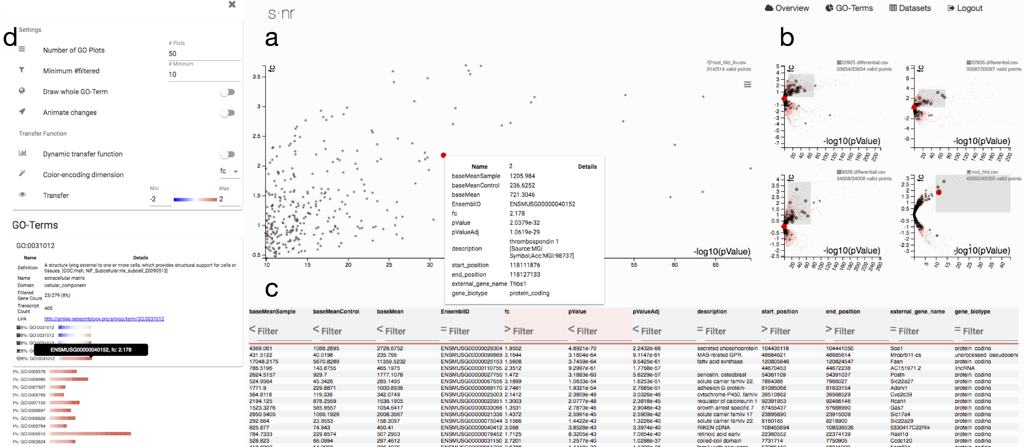
The selected experiments can be analyzed in the details view that provides simple yet efficient means for displaying and querying the data as well as extracting GO terms. The selection of genes feeds back into the overview visualization, which can be triggered again to only consider the user-defined subset of genes and refines the search of functionally similar experiments (left).